 CASS Blog
IFU cross-talk simulations
14/02/19 13:38 Filed in: Science
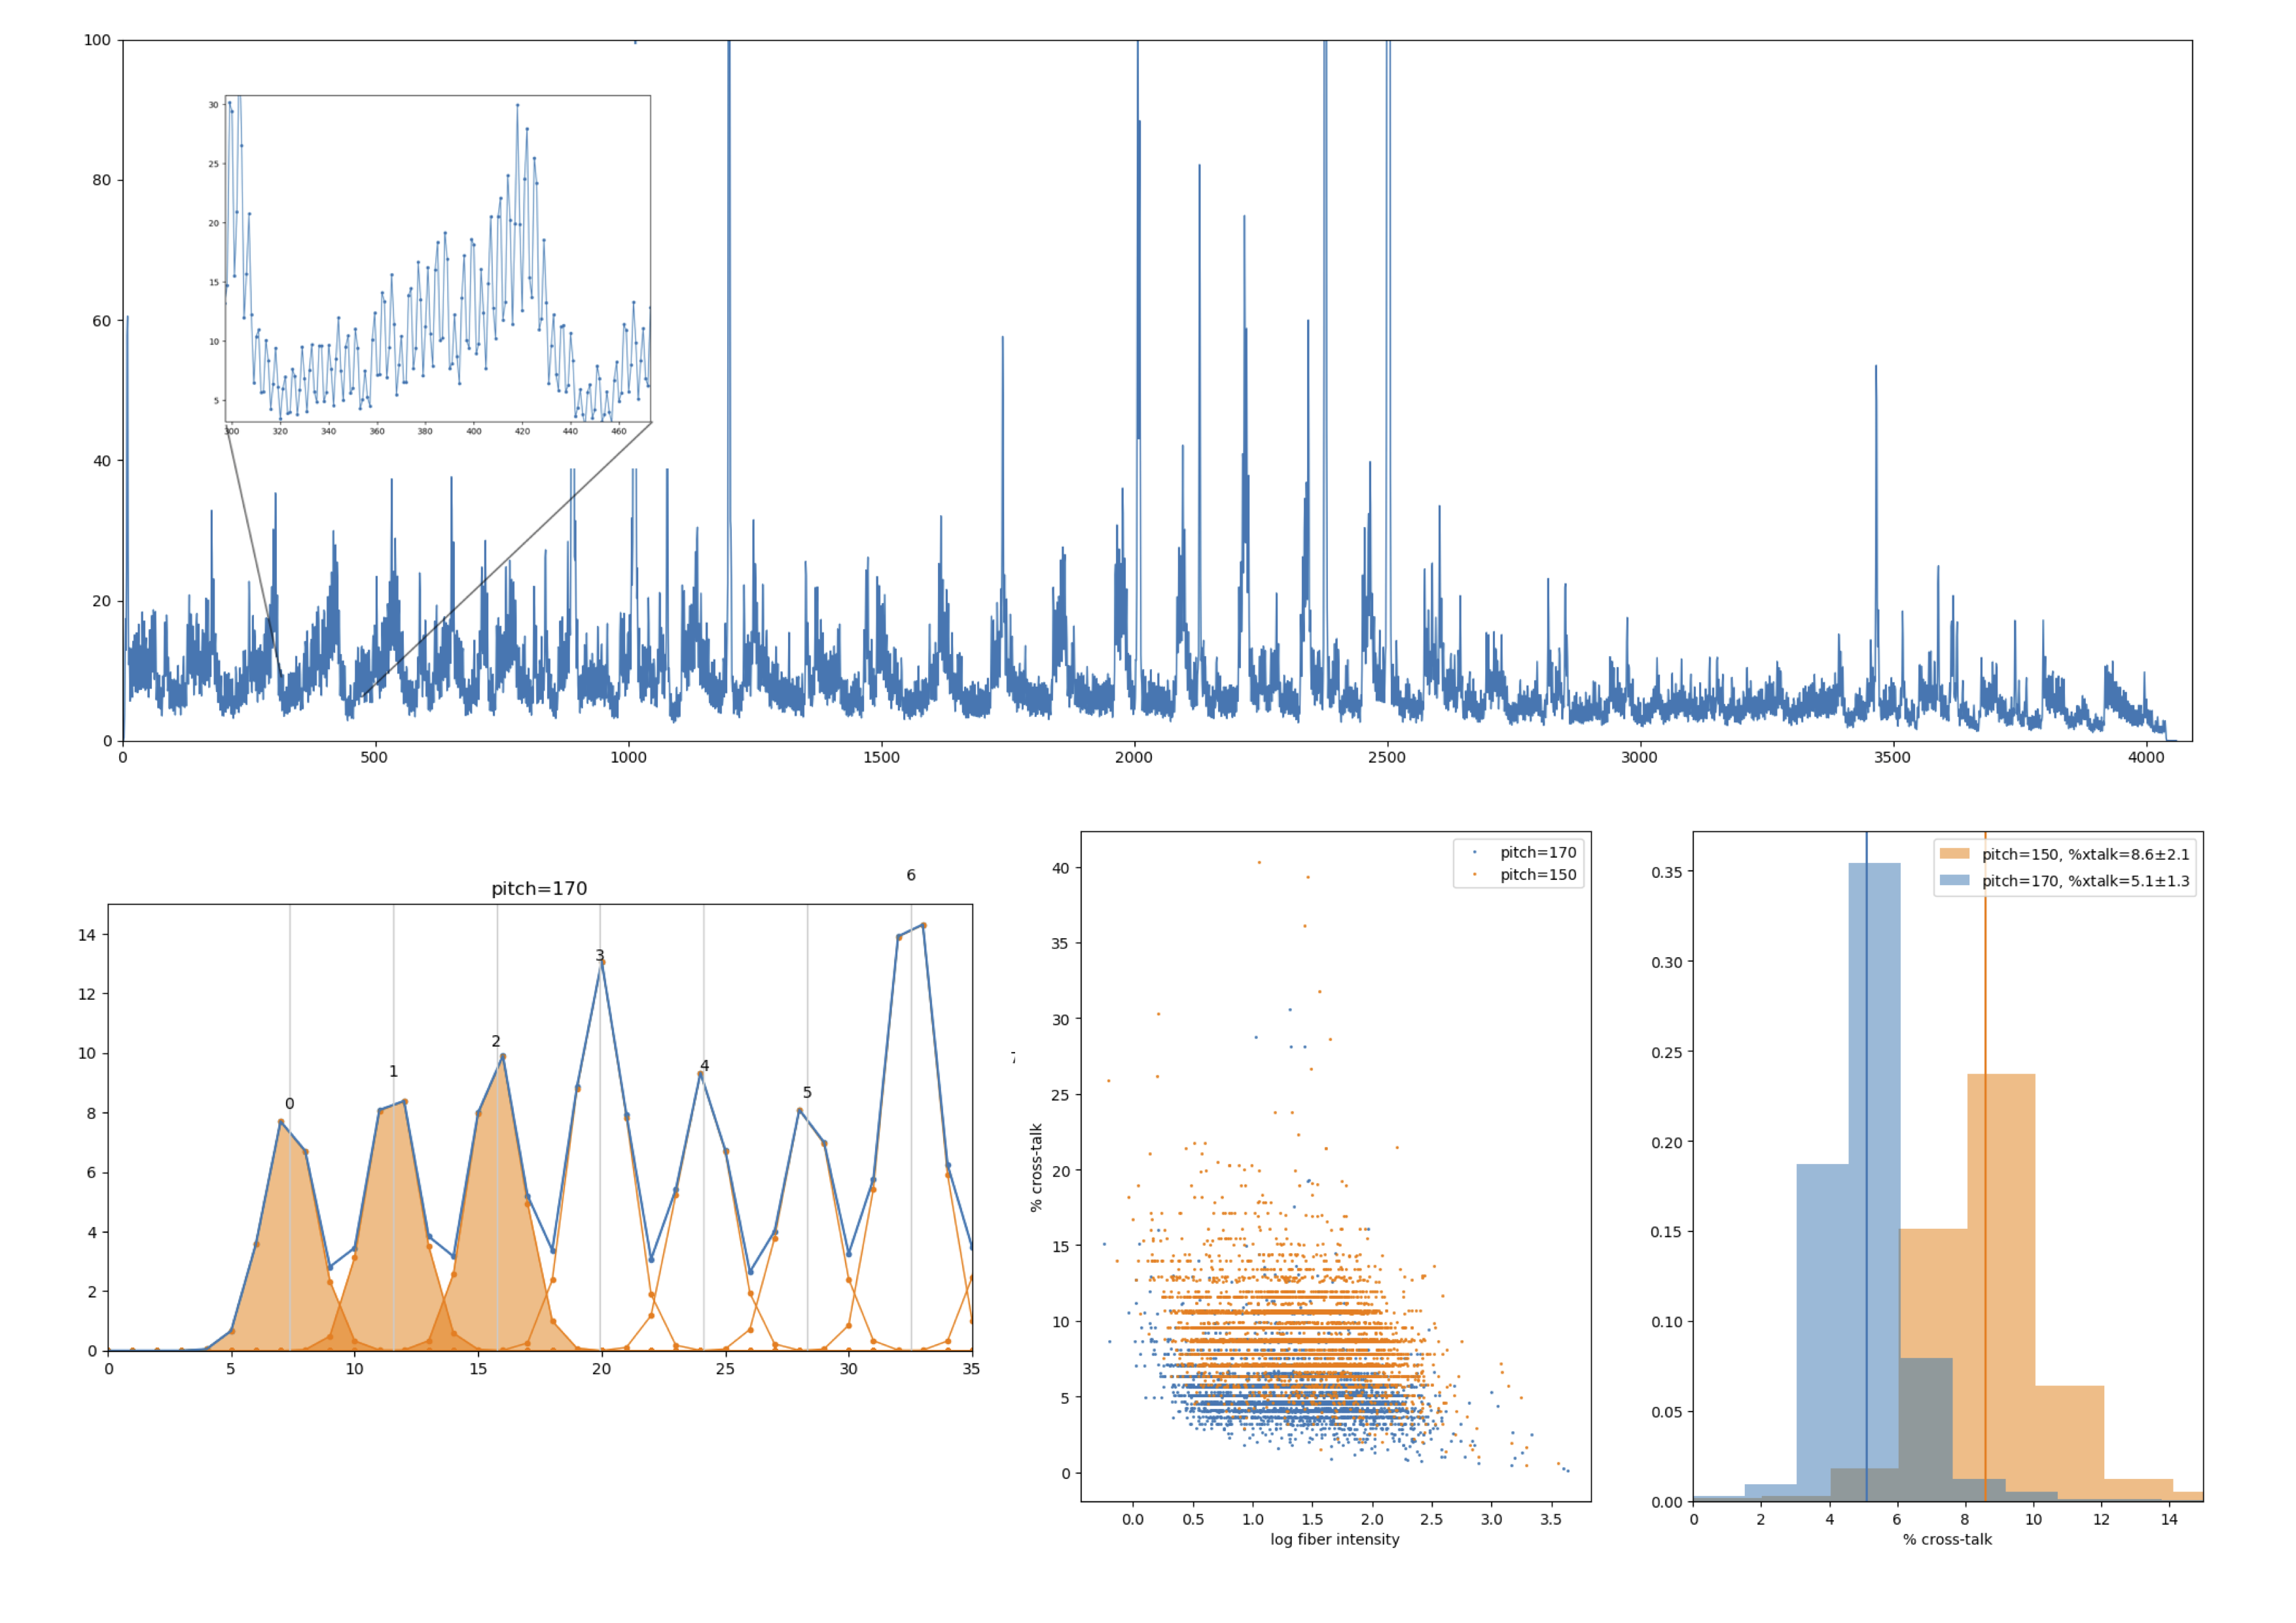
A single IFU pointing (cf. single pointing on M33) generates a spectral-spatial 2D image in the detector, with fibers arranged along the spatial direction. A slice of this image along the spatial direction is shown on the top plot of the enclosed image, with a zoomed in shown in the insert, where the single fiber PSF can be seen. A PSF model (e.g., a Gaussian) is fitted to each fiber PSF as shown in the bottom-left figure (in orange in the figure), and the cross-talk is defined as the fraction of the PSF that falls below neighbour fibers (darker orange wings). The two bottom-right figures give the values of cross-talk extracted for two different values of the fiber pitch at slit (the peak-to-peak separation of fibers along the slit) with values of 150 and 170 micron (credit: Enrique Pérez).