 CASS Blog
Science
A new JVLA radio survey of M33
13/03/19 18:35
White et al. (2019) have performed new 1.4 GHz and 5 GHz observations of the Local Group galaxy M33 with the Jansky Very Large Array. The survey has a limiting sensitivity of 20 μJy and a resolution of 5.9′′ (FWHM), corresponding to a spatial resolution of 24 pc. This map offers an unique opportunity for the comparison at the same spatial resolution with our planned LUCA IFU spectroscopy of M33 at the Schmidt telescope.

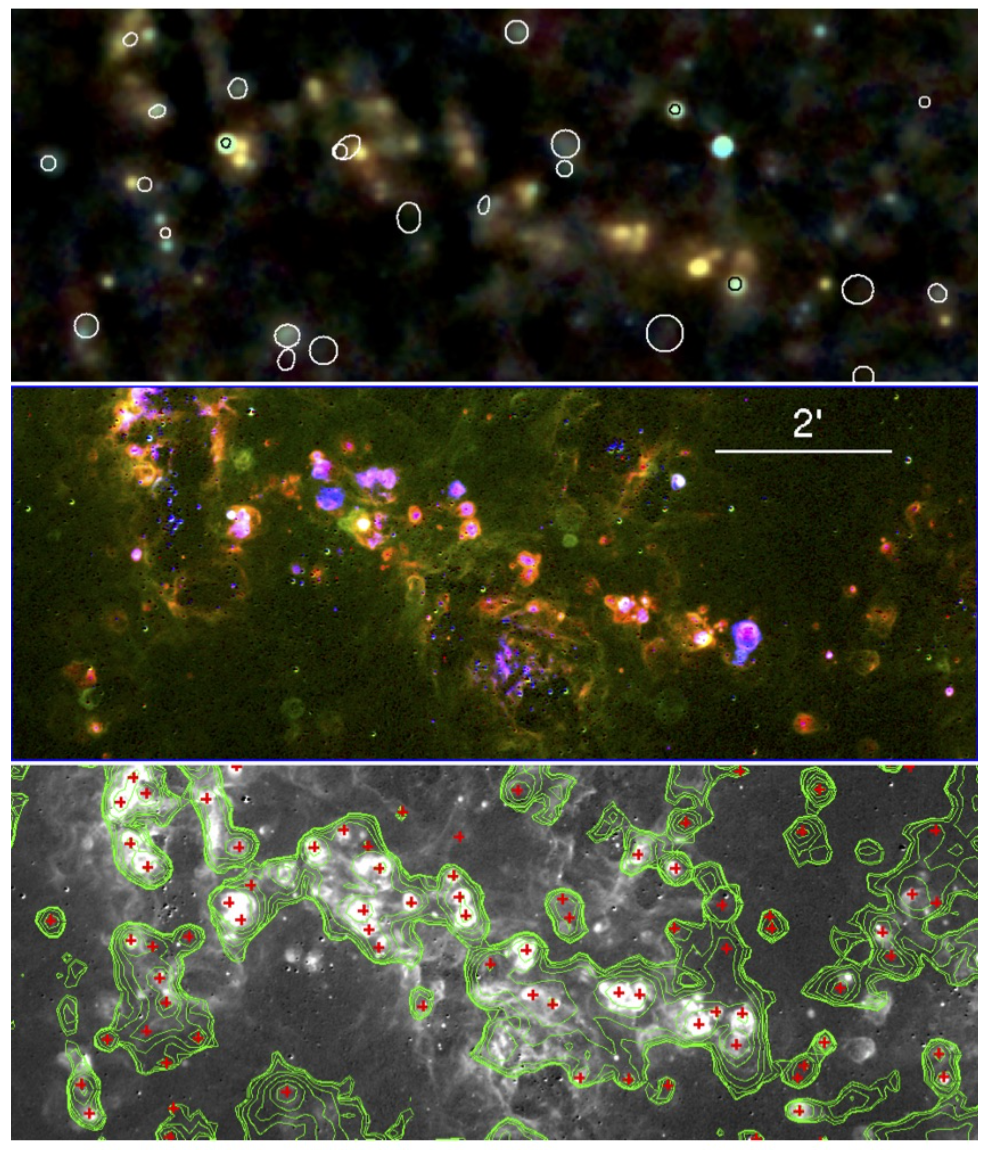
This figure, taken from White et al. (2019), shows a 4.4'′ by 10.7′ region of the southern spiral arm in M33. The top panel is the color radio spectral index map. Locations for optically-detected SNRs are shown as white ellipses; many can be identified by cross-referencing to the middle panel that shows a three-color image of continuum-subtracted emission line data, with Hα in red, [SII] in green, and [OIII] in blue. The bottom panel is a continuum-subtracted Hα image. The green overlay shows radio contours from the 1.4 GHz data. Red crosses mark the positions of radio sources from their catalog in this region. Some of the complexity of making associations between radio sources and either H II regions or SNRs can be seen here.
This figure, taken from White et al. (2019), shows a 4.4'′ by 10.7′ region of the southern spiral arm in M33. The top panel is the color radio spectral index map. Locations for optically-detected SNRs are shown as white ellipses; many can be identified by cross-referencing to the middle panel that shows a three-color image of continuum-subtracted emission line data, with Hα in red, [SII] in green, and [OIII] in blue. The bottom panel is a continuum-subtracted Hα image. The green overlay shows radio contours from the 1.4 GHz data. Red crosses mark the positions of radio sources from their catalog in this region. Some of the complexity of making associations between radio sources and either H II regions or SNRs can be seen here.
IFU cross-talk simulations
14/02/19 13:38
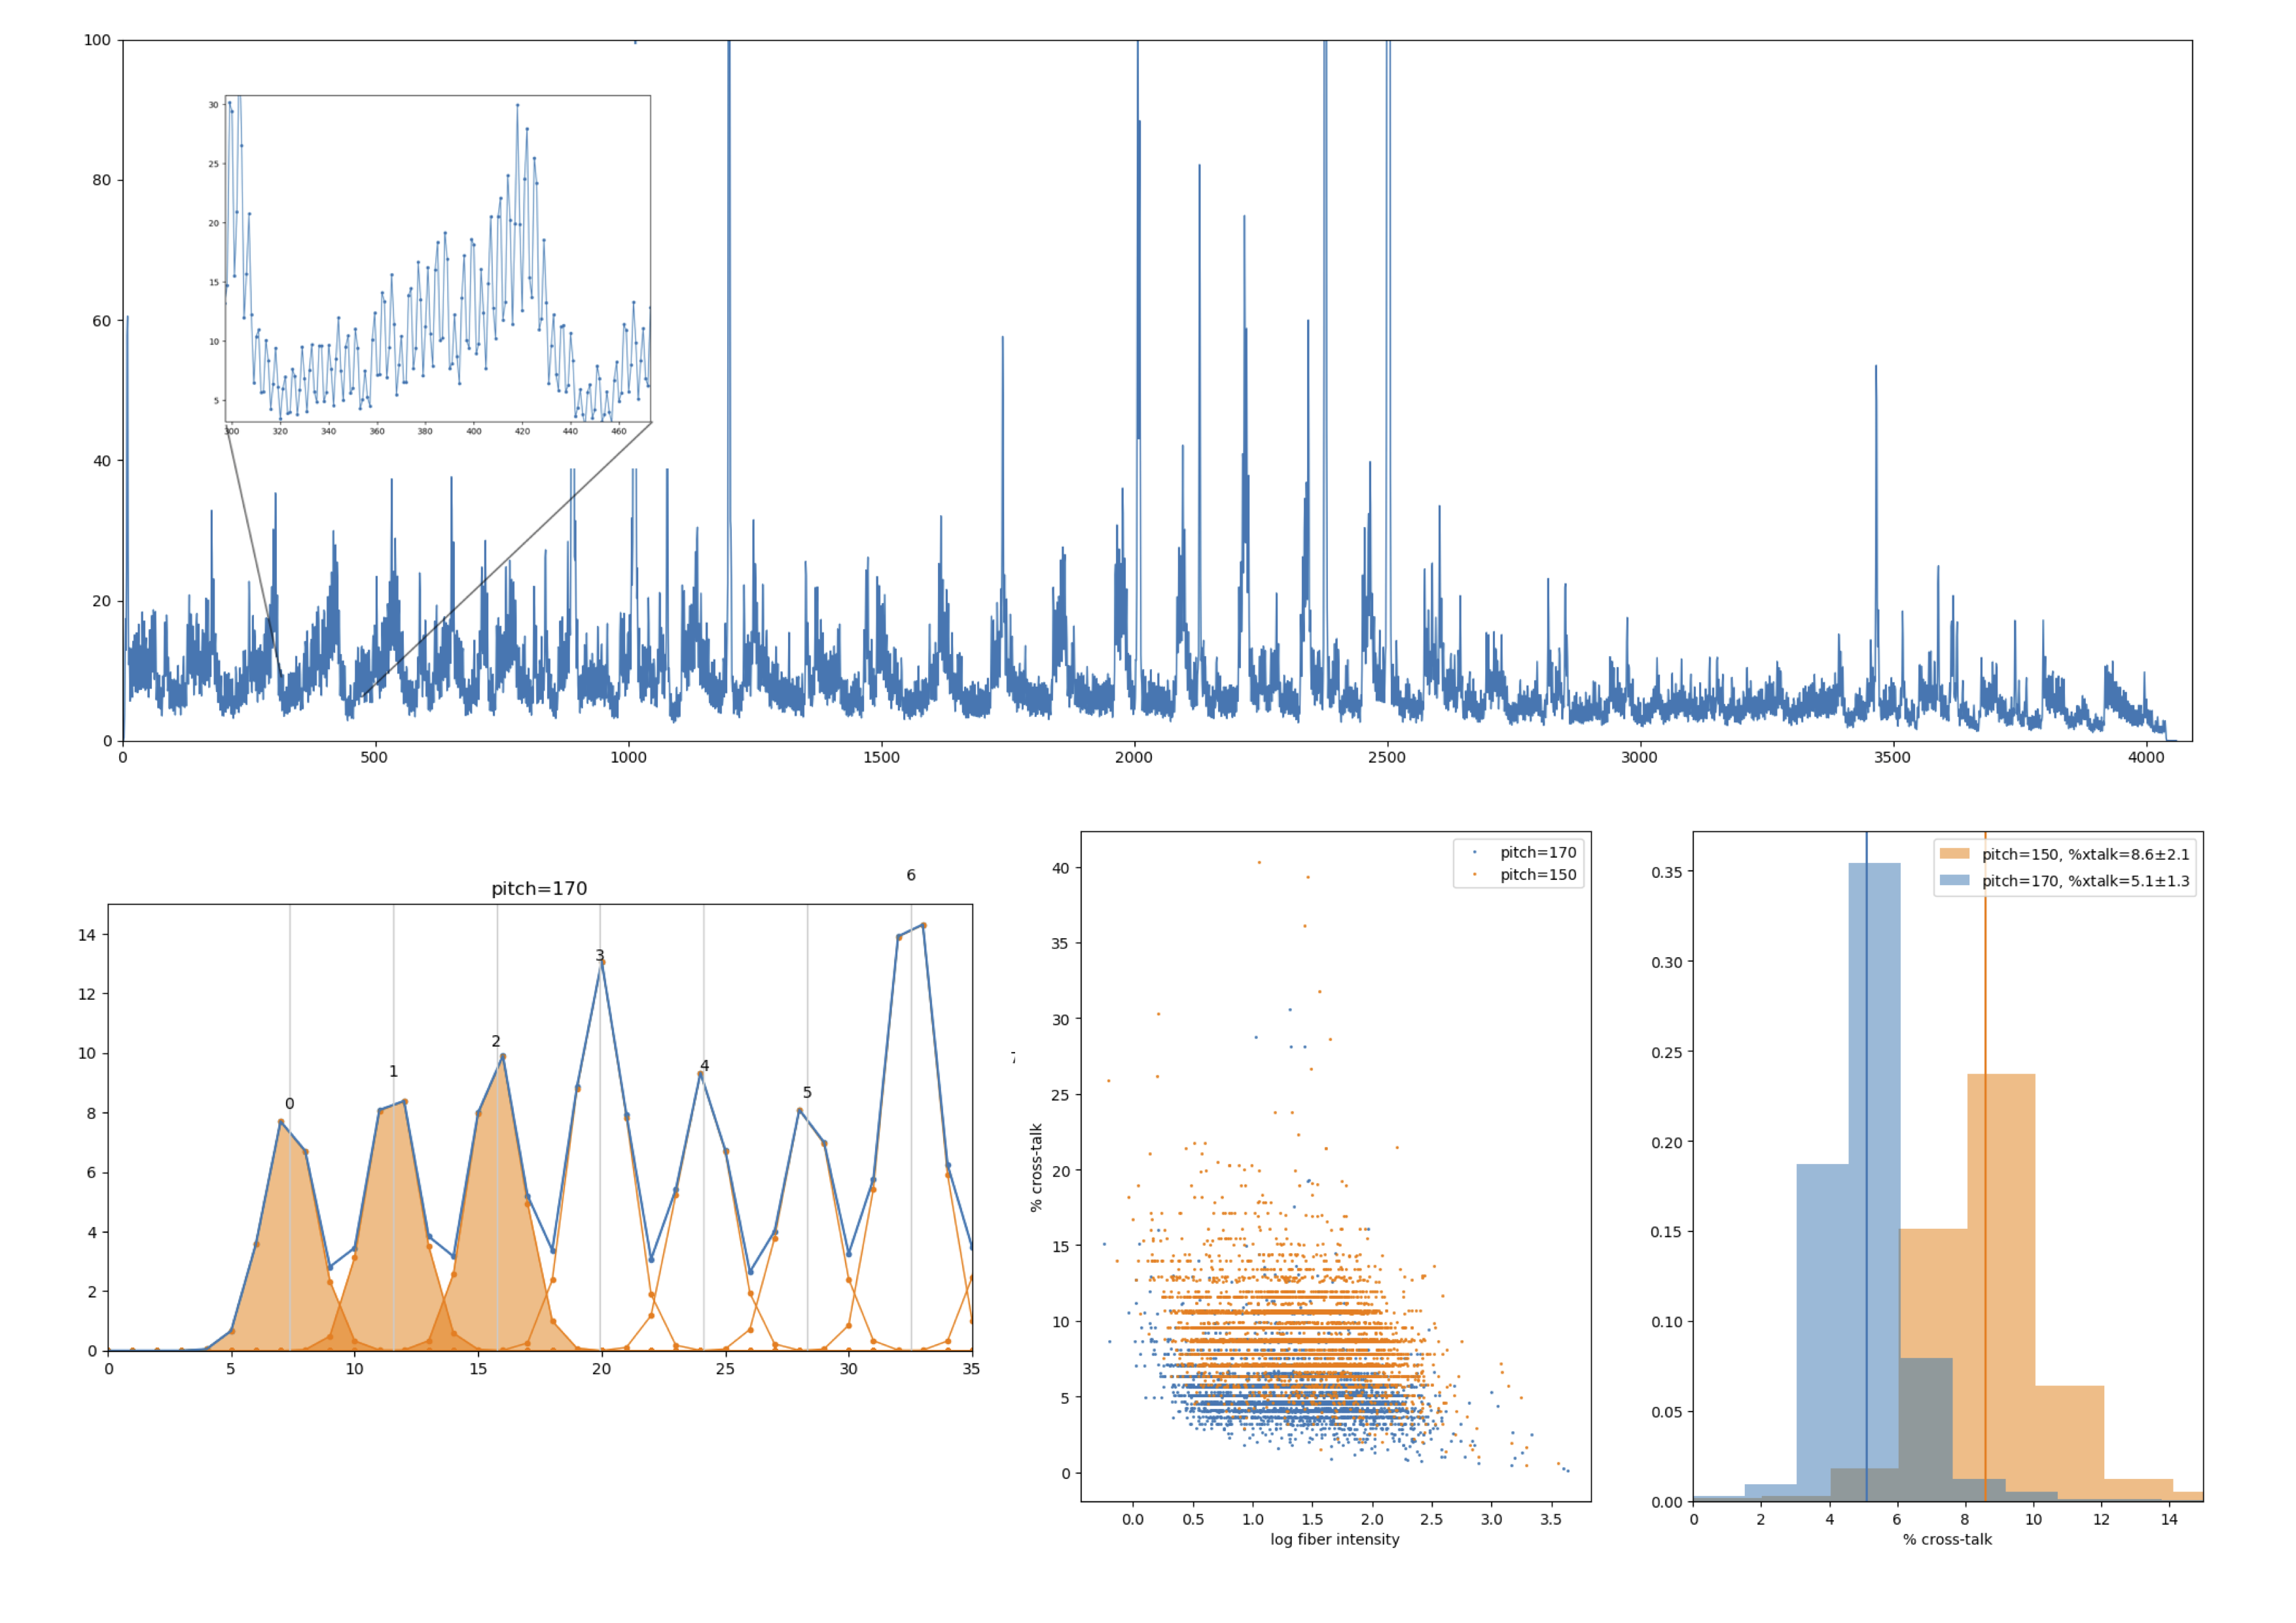
A single IFU pointing (cf. single pointing on M33) generates a spectral-spatial 2D image in the detector, with fibers arranged along the spatial direction. A slice of this image along the spatial direction is shown on the top plot of the enclosed image, with a zoomed in shown in the insert, where the single fiber PSF can be seen. A PSF model (e.g., a Gaussian) is fitted to each fiber PSF as shown in the bottom-left figure (in orange in the figure), and the cross-talk is defined as the fraction of the PSF that falls below neighbour fibers (darker orange wings). The two bottom-right figures give the values of cross-talk extracted for two different values of the fiber pitch at slit (the peak-to-peak separation of fibers along the slit) with values of 150 and 170 micron (credit: Enrique Pérez).

Hierarchical structure in the Pan-Andromeda Archaeological Survey
01/02/19 20:38
The Pan-Andromeda Archaeological Survey (McConnachie et al. 2018) is a survey of 400 square degrees centered on the Andromeda (M31) and Triangulum (M33) galaxies. A dozen of distinctive substructures were detected and produced by at least 5 different accretion events, all in the last 3 or 4 Gyrs. A few of the substructures furthest from M31 may be shells from a single accretion event. M31’s halo seems to be dominated by two "mega-structures" that can be considered as the two most significant branches of a merger tree produced by breaking M31’s stellar halo into smaller and smaller structures. One of the streams could in fact be associated primarily with M33’s halo. The CASS hyper-spectral data cubes will contribute to understanding the formation of the Pan-Andromeda system.

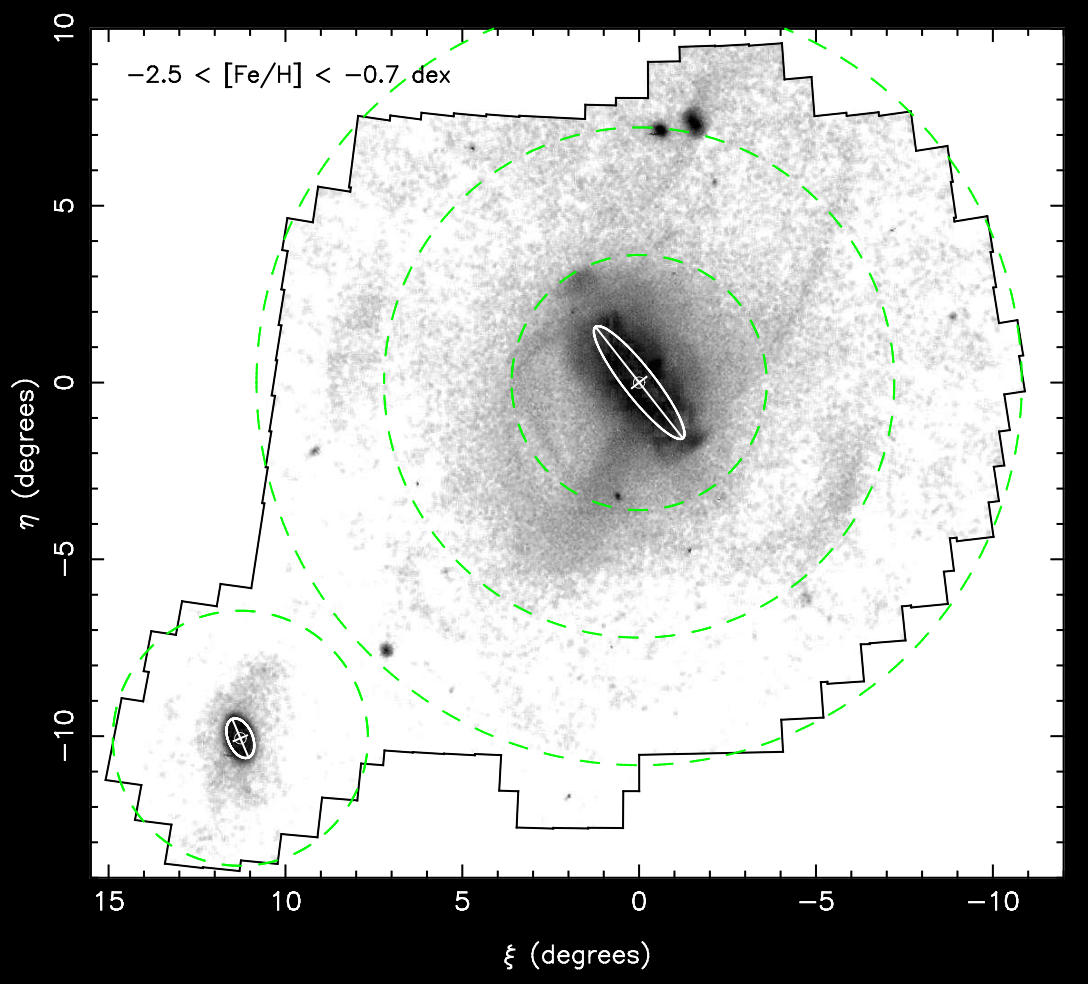
Tangent plane projection centered on M31 showing the spatial density distribution of candidate red giant branch stars. The dashed circles correspond to projected radii of 50kpc, 100kpc and 150kpc from M31, and 50 kpc from M33 (Figure 11 in McConnachie et al. 2018).
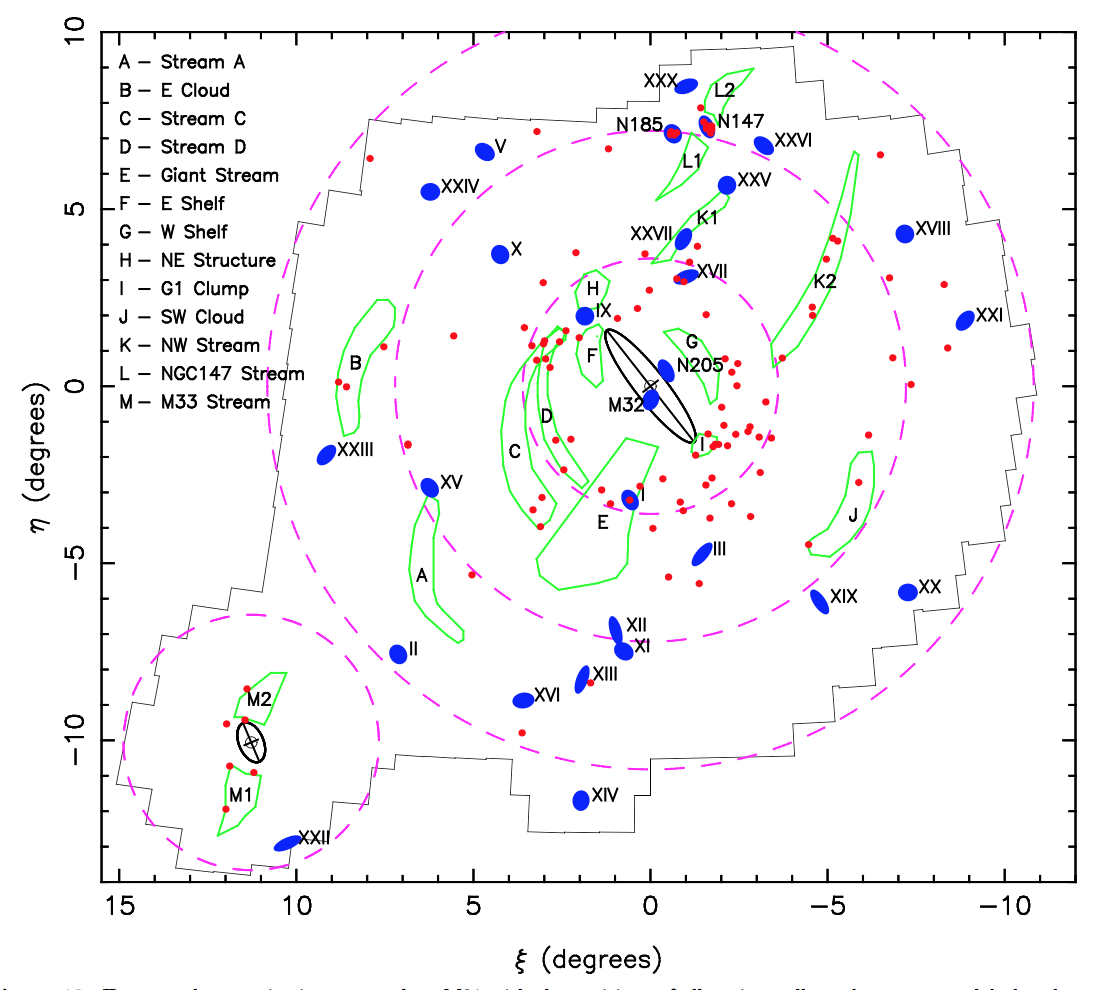
Tangent plane projection centered on M31 with the positions of all major stellar substructures, globular clusters and dwarf galaxies highlighted (Figure 12 in McConnachie et al. 2018).